承接上文【JVM性能调优以及实操】
1. 简介
Arthas是Alibaba在2018年9月开源的Java诊断工具,支持JDK6+,采用命令行交互模式,可以方便的定位和诊断线上程序运行问题。
相比JDK内置的诊断工具,更人性化,并且功能更加强大,而且可以一键反编译类查看源码,甚至直接运行生产代码热修复,实现在一个工具内快速定位和修复问题的一站式解决方案。
官网地址:https://alibaba.github.io/arthas
2. Arthas 使用场景
得益于Arthas强大且丰富的功能,让Arthas能做的事情超乎想象,下面仅仅列举几项常见的使用情况:
是否有一个全局视角来查看系统的运行情况
为什么CPU又升高来,到底哪里占用了CPU
运行的多线程有死锁么?有阻塞么?
程序运行耗时很长,在哪里耗时比较长?如何监测?
这个类从哪个jar包加载的?为什么会报各种类的相关的Exception?
我改的代码为什么没有执行到?难道是没有commit?分支搞错了?
遇到问题无法在线上debug,难道只能通过加日志再重新发布吗?
有什么办法可以监控到JVM的实时运行状态?
3. 实战
3.1 编写测试代码
1
2
3
4
5
6
7
8
9
10
11
12
13
14
15
16
17
18
19
20
21
22
23
24
25
26
27
28
29
30
31
32
33
34
35
36
37
38
39
40
41
42
43
44
45
46
47
48
49
50
51
52
53
54
55
56
57
58
59
60
61
62
63
64
65
66
67
68
69
70
71
72
73
74
75
76
77
78
79
|
public class ArthasDemo {
private static HashSet<String> hashSet = new HashSet<>();
public static void main(String[] args) {
cpuHigh();
deadThread();
addHashSetThread();
}
public static void cpuHigh() {
new Thread(() -> {
while (true) {
}
}).start();
}
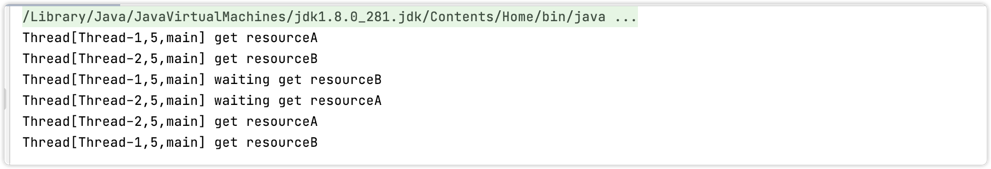
private static void deadThread() {
Object resourceA = new Object();
Object resourceB = new Object();
Thread threadA = new Thread(() -> {
synchronized (resourceA) {
System.out.println(Thread.currentThread() + " get resourceA");
try {
Thread.sleep(1000);
} catch (InterruptedException e) {
}
System.out.println(Thread.currentThread() + " waiting get resourceB");
synchronized (resourceB) {
System.out.println(Thread.currentThread() + " get resourceB");
}
}
});
Thread threadB = new Thread(() -> {
synchronized (resourceB) {
System.out.println(Thread.currentThread() + " get resourceB");
try {
Thread.sleep(1000);
} catch (InterruptedException e) {
}
System.out.println(Thread.currentThread() + " waiting get resourceA");
synchronized (resourceA) {
System.out.println(Thread.currentThread() + " get resourceA");
}
}
});
threadA.start();
threadB.start();
}
public static void addHashSetThread(){
new Thread(()->{
int count = 0;
while (true){
try {
hashSet.add("count"+count);
Thread.sleep(1000);
}catch (InterruptedException e){
e.printStackTrace();
}
}
}).start();
}
}
|
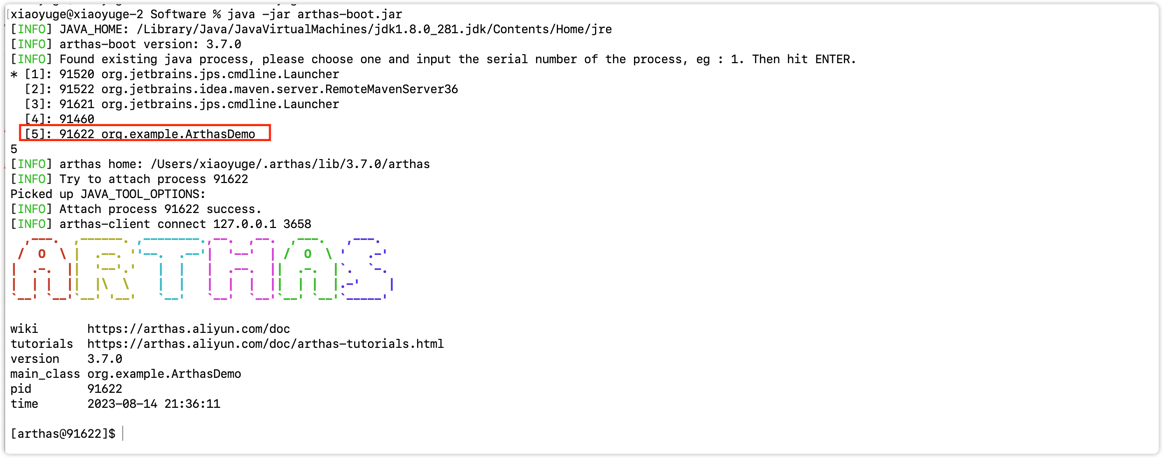
启动程序!下面启动arthas-boot.jar时会识别所有的Java进程。
3.2 下载
1
2
3
4
5
6
7
8
| # github下载arthas
wget https://alibaba.github.io/arthas/arthas‐boot.jar
# 或者 Gitee 下载
wget https://arthas.gitee.io/arthas‐boot.jar
#或者 curl
curl -O https://alibaba.github.io/arthas/arthas-boot.jar
java -jar arthas-boot.jar
|
启动程序后,然后查看上面的测试代码的pid编号,输入即可。
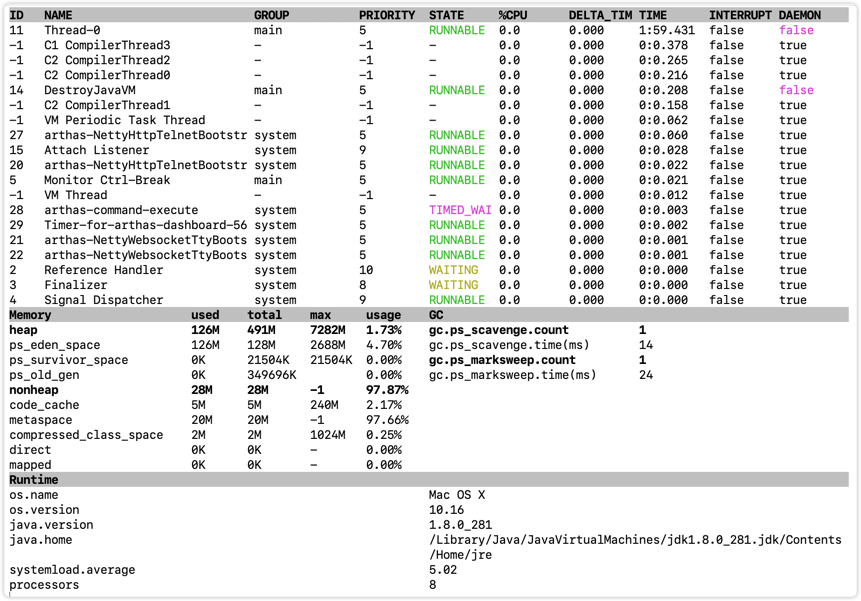
输入dashboard可以查看整个进程的运行情况,线程、内存、GC、运行环境信息:
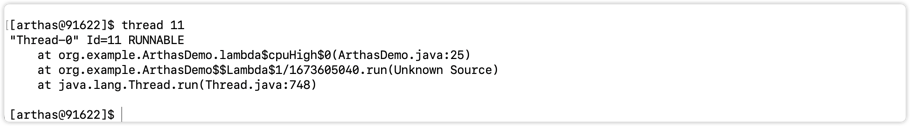
输入thread可以查看线程详细情况

在上图可以查看到ID为11的Thread占用CPU资源较高,可以使用thread ID查看线程堆栈
输入thread -b可以查看到线程死锁(-b 表示blocking)

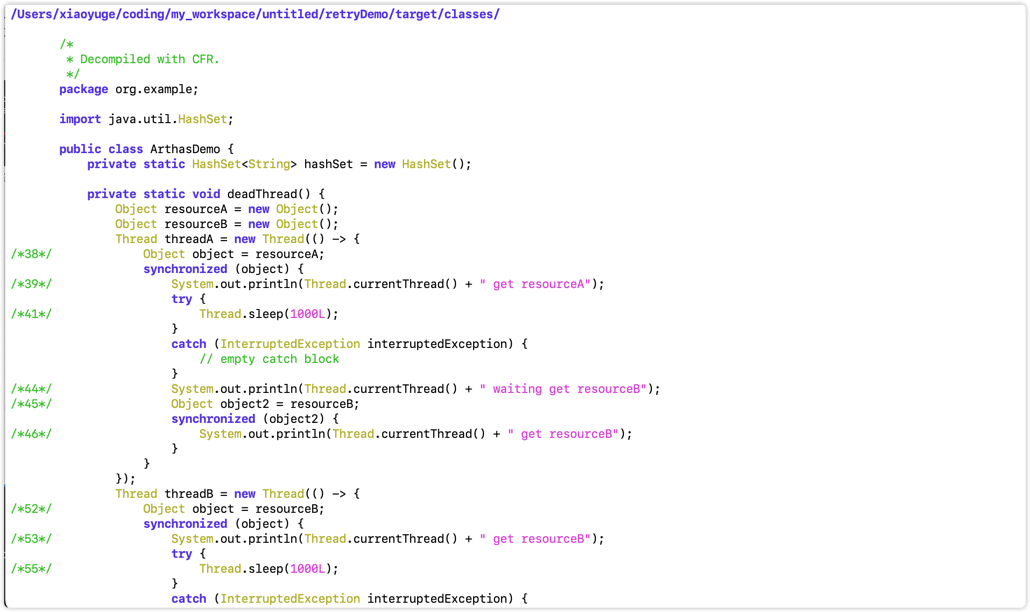
输入jad 加类的全名可以反编译,这样可以方便我们查看线上代码是否时正确的版本
1
| jad org.example.ArthasDemo
|
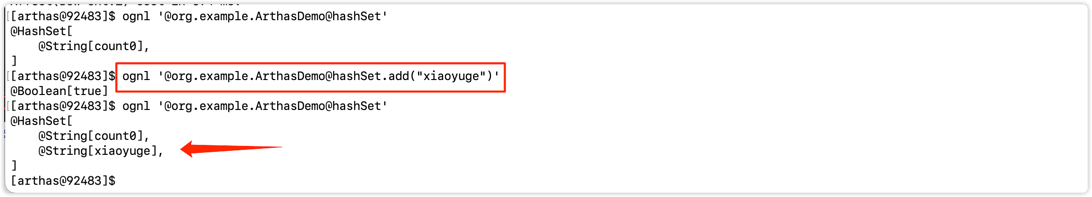
- 输入
ognl命令可以查看线上系统变量的值,甚至可以修改变量的值1
2
3
4
5
| #查看变量的值
ognl '@org.example.ArthasDemo@hashSet'
#修改变量的值
ognl '@org.example.ArthasDemo@hashSet.add("xiaoyuge")'
|
更多命令使用可以用help命令查看,或查看文档:https://alibaba.github.io/arthas/commands.html#arthas

