1. 摘要
Springboot 自带监控功能Actuator,可以帮助实现对程序内部运行情况监控,比如健康检查、设计、指标搜集、监控状况、Bean加载情况、环境变量、日志信息、线程信息等。
这个模块时一个采集应用内部信息暴露给外部的模块,上述的功能都可以通过HTTP和JMX 访问。因为暴露内部信息的特性,Actuator也可以和一些外部的应用监控系统整合(Prometheus、Graphite、DataDog、Influx、Wavefront、New Relic等)
这些监控系统提供了出色的仪表板、图形、分析和报警,可以帮助你通过一个统一友好的界面,监控和管理应用程序
注意:SpringBoot 1.x 和 2.x 的 Actuator 监控設定差超多,不僅提供的 endpoint 路徑不一樣,連 application.properties 的配置也不一樣,此處介紹的為 SpringBoot 2.x 版本。
2. 集成Actuator
配置pom.xml
1
2
3
4
5
6
7
8
9
10<dependency>
<groupId>org.springframework.boot</groupId>
<artifactId>spring-boot-starter-web</artifactId>
<version>2.3.5.RELEASE</version>
</dependency>
<dependency>
<groupId>org.springframework.boot</groupId>
<artifactId>spring-boot-starter-actuator</artifactId>
<version>2.3.5.RELEASE</version>
</dependency>配置启用所有监控端点
1
2
3
4
5
6
# 默认情况下,这些端点时禁用的,Springboot2.x版本只开放了health和info两个端点
management:
endpoints:
web:
exposure:
include: "*" # * 代表所有监控端点,可以单独启用,例如healthy、info、metrics等启动程序访问
http://localhost:8080/actuator查看暴露的端点1
2
3
4
5
6
7
8
9
10
11
12
13
14
15
16
17
18
19
20
21
22
23
24
25
26
27
28
29
30
31
32
33
34
35
36
37
38
39
40
41
42
43
44
45
46
47
48
49
50
51
52
53
54
55
56
57
58
59
60
61
62
63
64
65
66
67
68
69
70
71
72
73
74
75
76
77
78
79
80
81
82
83
84
85
86
87
88
89
90
91
92
93
94
95{
"_links": {
"self": {
//查看有哪些 Actuator endpoint 是開放的
"href": "http://127.0.0.1:8080/actuator",
"templated": false
},
"beans": {
//查看运行的全部bean,以及他们的关系
"href": "http://127.0.0.1:8080/actuator/beans",
"templated": false
},
"caches": {
"href": "http://127.0.0.1:8080/actuator/caches",
"templated": false
},
"caches-cache": {
"href": "http://127.0.0.1:8080/actuator/caches/{cache}",
"templated": true
},
"health-path": {
//查看运行的健康指标
"href": "http://127.0.0.1:8080/actuator/health/{*path}",
"templated": true
},
"health": {
//报告应用程序的健康指标,这些值由 HealthIndicator 的实现类提供
"href": "http://127.0.0.1:8080/actuator/health",
"templated": false
},
"info": {
//查看properties中info开头的属性
"href": "http://127.0.0.1:8080/actuator/info",
"templated": false
},
"conditions": {
//查看自动配置的结果,记录哪些自动配置条件通过了,哪些没有通过
"href": "http://127.0.0.1:8080/actuator/conditions",
"templated": false
},
"configprops": {
//查看注入带有@ConfigurationProperties类的properties值是什么(包括默认直)
"href": "http://127.0.0.1:8080/actuator/configprops",
"templated": false
},
"env-toMatch": {
"href": "http://127.0.0.1:8080/actuator/env/{toMatch}",
"templated": true
},
"env": {
//查看全部的环境属性,可以看到springboot载入了哪些properties,以及这些properties的值,但是会
//自动屏蔽掉key,password,secret等关键字的值
"href": "http://127.0.0.1:8080/actuator/env",
"templated": false
},
"loggers-name": {
"href": "http://127.0.0.1:8080/actuator/loggers/{name}",
"templated": true
},
"loggers": {
//显示和修改配置的loggers
"href": "http://127.0.0.1:8080/actuator/loggers",
"templated": false
},
"heapdump": {
//取得jvm当下的head dump
"href": "http://127.0.0.1:8080/actuator/heapdump",
"templated": false
},
"threaddump": {
//获取线程活动的快照
"href": "http://127.0.0.1:8080/actuator/threaddump",
"templated": false
},
"metrics": {
//查看哪些指标可以看(ex:jvm.memory.max、system.cpu.usage)再使用/{metric.name}查看明细
"href": "http://127.0.0.1:8080/actuator/metrics",
"templated": false
},
"metrics-requiredMetricName": {
"href": "http://127.0.0.1:8080/actuator/metrics/{requiredMetricName}",
"templated": true
},
"scheduledtasks": {
//展示应用中的定时任务信息
"href": "http://127.0.0.1:8080/actuator/scheduledtasks",
"templated": false
},
"mappings": {
//描述全部的 URI路径,以及它们和控制器(包含Actuator端点)的映射关系
"href": "http://127.0.0.1:8080/actuator/mappings",
"templated": false
}
}
}
3. Actuator 的Rest接口
Actuator监控分成两类:原生端点和用户自定义端点;自定义端点主要是指扩展性,用户可以根据自己的实际应用,定义一些比较关心的指标,在运行期间进行监控。
原生端点是应用程序提供众多web接口,通过它们了解应用程序运行是的内部状况,原生端点又可以分成三类:
应用配置类:可以查看应用在运行期间的静态信息:例如自动配置信息、加载的spring bean信息、yaml文件配置信息、环境信息、请求映射信息;
度量指标类:主要是运行期的动态信息,例如堆栈、请求链、健康指标、metrics信息等
操作控制类:主要是指shutdown,用户可以发送一个请求将应用的监控功能关闭
Actuator几乎监控一个应用设计的方方面面,这里列举一些常用的命令。
3.1 health
health主要用来检查应用的运行状态,通过此接口提醒我们实例的运行状态,以及不”健康”的原因,比如数据库连接、磁盘空间不足等。
默认情况下,health的状态是开放的,通过访问/actuator/healthy即可以看到应用的状态
1 | { |
要想查看详细的健康信息需要配置management.endpoint.health.show-details = alawys
| 名称 | 描述 |
|---|---|
| never | 详细信息不显示(默认) |
| when-authorized | 详细信息仅显示给授权用户,可以使用management.endpoint.health.roles配置授权用户 |
| always | 详细信息显示给所有用户 |
| 再次访问健康信息 |
1 | { |
Springboot的健康信息都是从ApplicationContext中的各种HealthIndicator Beans中收集到的,springboot框架包含大量的HealthIndicators的实现类,也可以自定义实现健康状态
默认情况下,最终的Springboot应用状态是由HealthAggreagator汇总而成的,汇总的算法是:
设置状态吗顺序:
setStatusOrder(Status.DOWN, Status.OUT_OF_SERVICE, Status.UP, Status.UNKNOWN);过滤掉不能识别的状态码
如果无任何状态码,整个springboot应用的状态是
UNKNOWN将所有收集到的状态码按照1中的顺序排序
返回有序状态码序列中的第一个状态码,作为整个Springboot应用的状态
health 通过合并几个健康指数检查应用的健康状态,Springboot框架自带的HealthIndicators目前包括:
| 类 | 说明 |
|---|---|
| CassandraHealthIndicator | Checks that a Cassandra database is up. |
| DiskSpaceHealthIndicator | Checks that a connection to DataSource can be obtained |
| ElasticsearchHealthIndicator | Checks that an Elasticsearch cluster is up |
| InfluxDbHealthIndicator | Checks that an InfluxDB server is up. |
| JmsHealthIndicator | Checks that a JMS broker is up. |
| MailHealthIndicator | Checks that a mail server is up. |
| MongoHealthIndicator | Checks that a Mongo database is up. |
| Neo4jHealthIndicator | Checks that a Neo4j server is up. |
| RabbitHealthIndicator | Checks that a rabbit server is up. |
| RedisHealthIndicator | Checks that a Redis server is up. |
| SolrHealthIndicator | Checks that a Solr server is up. |
举个例子,如果你的应用使用 Redis,RabbitHealthIndicator 将被当作检查的一部分;如果使用 MongoDB,那么MongoHealthIndicator 将被当作检查的一部分。
可以在配置中关闭特定的健康检查指标,比如关闭redis的健康检查
1 | management: |
3.2 info
info就是我们自己配置在配置文件中以info开头的配置信息,比如
1 | info: |
启动后,访问:/actuator/info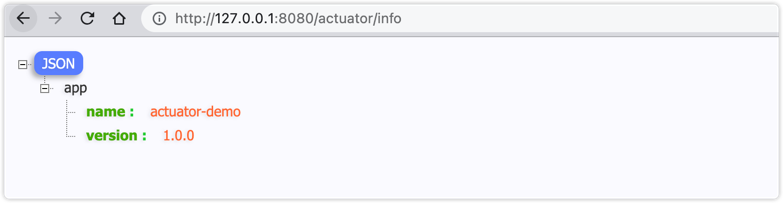
3.3 beans
展示bean的别名、类型、是否单例、类的地址、依赖等信息;访问:/actuator/beans,这里只展示部分内容:
1 | { |
3.4 conditions
Springboot的自动配置功能非常遍历,但有时候也意味着找出问题比较麻烦,使用conditions可以在应用运行时查看代码某个配置在什么条件下生效,或者某个自动配置为什么没有生效。
访问链接:htttp://localhsot:8080/actuator/conditions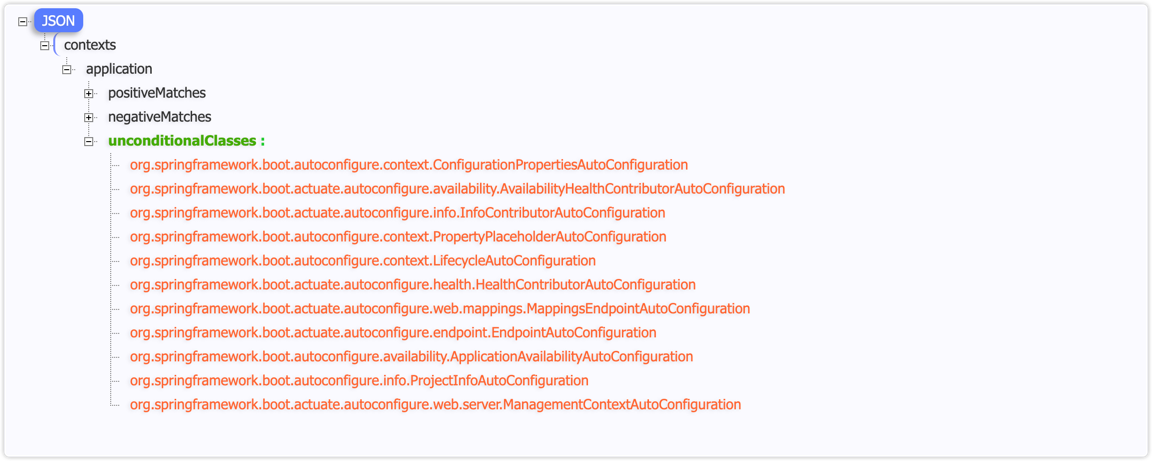
返回部分信息如下:
1 | { |
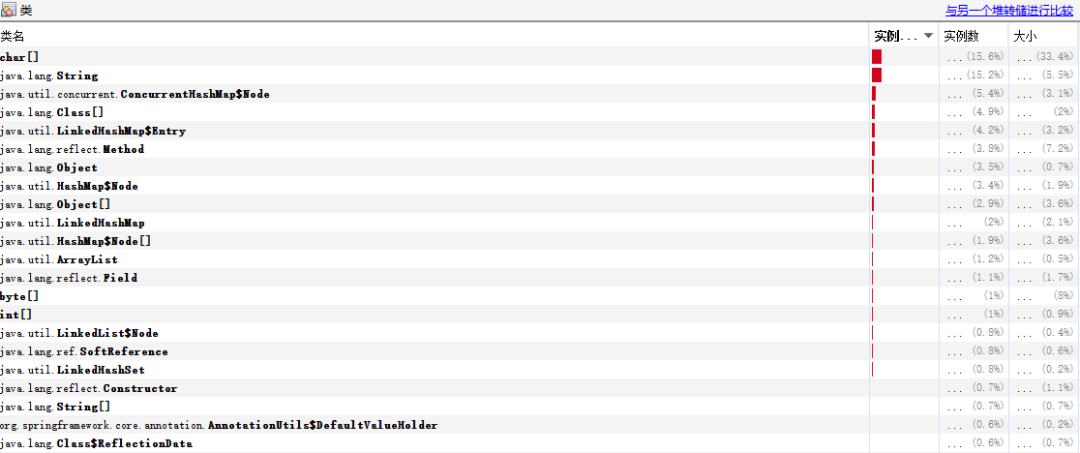
3.5 heapdump
返回一个GZip压缩的JVM堆dump
访问:/actuator/heapdump会自动生成一个jvm的堆文件heapdump,可以使用jdk自带的jvm监控工具VisualVm打开此文件查看内存快照
3.6 shutdown
开启接口优雅关闭Springboot应用,要使用这个功能需要在配置文件中开启
1 | management: |
配置完成后,使用curl模拟post请求shutdown接口
shutdown 接口默认只支持post请求
1 | curl -X POST "http://localhost:8080/actuator/shutdown" |
3.7 mappings
描述全部的URI路径,以及他们和控制器的映射关系;
定义一个TestController
1 |
|
通过访问:/actuator/mappings返回部分信息如下:
1 | { |
3.8 threaddump
threaddump接口会生成当前线程活动的快照,方便我们定位问题时查看线程的情况,主要展示了线程名、线程ID、线程状态、是否等待锁资源等信息。
通过访问:/actuator/threaddump,返回部分信息如下:
1 | [ |
生产出现问题的时候,可以通过应用的线程快照来检测应用正在执行的任务。
3.9 loggers
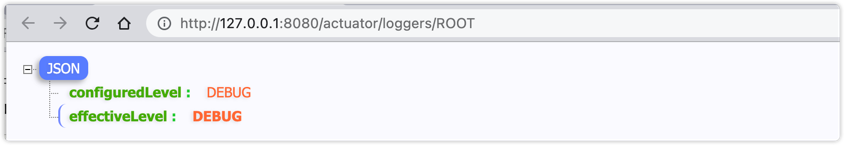
访问/actuator/loggers可以查看当前的日志级别等信息
1 | { |
一般情况下我们生产环境的日志级别都是info,如果出现bug通过info级别无法排查,可以通过临时修改ROOT节点的info级别,使用postman发送一个post请求修改日志级别

修改之后,可以看到日志由原来的info变成类debug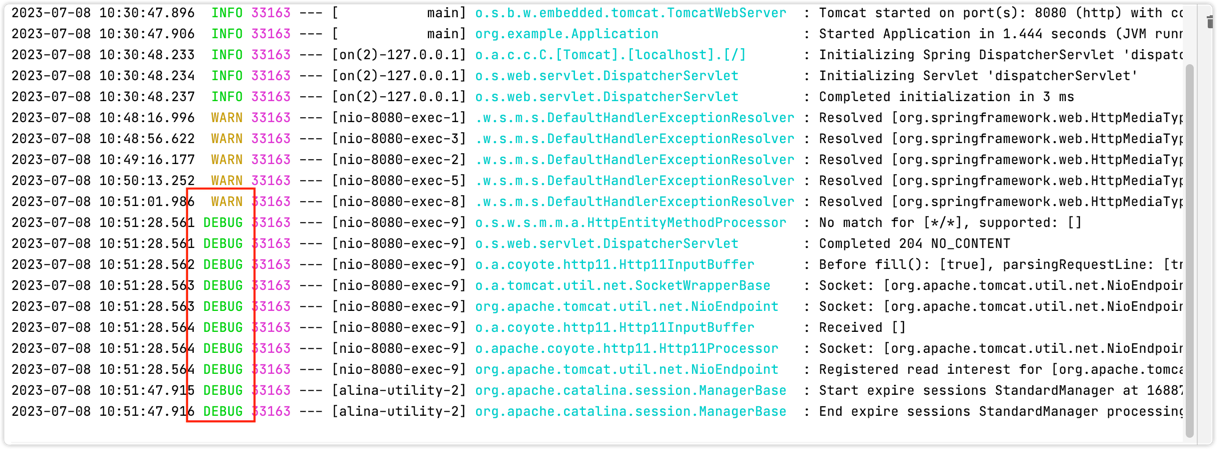
3.10 metrics
metrics是一个非常重要的监控端点,其监控内容覆盖类JVM内存、堆、类加载、处理器和tomcat容器等一些重要指标
1 | { |
可以看到这里面包含类很多指标,任意访问一个指标就可以查看对应指标的信息
1 | http://localhost:8080/actuator/metrics/http.server.requests |
1 | { |
4. 自定义 Endpoint
自定义配置来控制是否开启过滤
1 | actuator: |
自定义一个监控端点主要有如下常用类注解:
@Endpoint:定义一个监控端点,同时支持HTTP和JMX两种方式@WebEndpoint:定义一个监控端点,只支持HTTP@JmxEndpoint:定义一个监控端点,只支持JMX
以上三个注解作用在类上,表示当前类是一个监控端点,另外还有一些注解作用在方法和参数上:
@ReadOperation: 作用在方法上,可用来返回端点展示的信息(通过GET方法请求)@WriteOperation: 作用在方法上,可用来修改端点展示的信息(通过POST方法请求)@DeleteOperation: 作用在方法上,可用来删除端点展示的信息(通过GET方法请求)@Selector: 作用在参数上,可用定位一个端点的具体指标路由
一般情况下,是没必要自定义Endpoint的,但是也不排除特殊情况,我这里自定义一个Endpoint,用来往request里放一个user对象,这个user是用来做测试的,用于下面突破filter用的(下面再说),这里先说怎么增查这个user。
过程如下:
使用
@Endpoint注解相应的类,作为Actuator的一个endpoint。注解要指定id,这个id作为访问路径,比如这里是/actuator/super;@ReadOperation来注解查询接口,如果要根据路径做查询,要用@Selector注解方法参数;注意这地方是@Selector String arg0,这个arg0不能改变,改成其他的,开放出去的接口还是/{arg0},这就导致你的方法无法正常获取参数值。@WriteOperation来注解修改接口,注意请求数据必须是json,而且参数不像controller中那么灵活,不能将实体作为参数,要把实体中相应的属性拿出来做参数。这里在增加用户时,往
request里放一个user对象。
- 定义端点注意
1
2
3
4
5
6
7
8
9
10
11
12
13
14
15
16
17
18
19
20
21
22
23
24
25
26
27
28
29
30
31
32
33
34
35
36
37
38
39
40
41
42
43
44
45
46
47
48
49
50
51
52
53
54
55
56
57
58
59
60
61
62import java.util.Map;
import java.util.Set;
import java.util.concurrent.ConcurrentHashMap;
import javax.servlet.http.HttpServletRequest;
import org.springframework.boot.actuate.endpoint.annotation.Endpoint;
import org.springframework.boot.actuate.endpoint.annotation.ReadOperation;
import org.springframework.boot.actuate.endpoint.annotation.Selector;
import org.springframework.boot.actuate.endpoint.annotation.WriteOperation;
import org.springframework.web.context.request.RequestContextHolder;
import org.springframework.web.context.request.ServletRequestAttributes;
public class SuperEndPoint {
private Map<String, SuperUser> users = new ConcurrentHashMap<>();
public Set<String> users() {
return users.keySet();
}
public SuperUser usersIdentify( String arg0) {
return users.get(arg0);
}
public Set<String> set(String userName, String passwd) {
HttpServletRequest request = ((ServletRequestAttributes) RequestContextHolder.getRequestAttributes())
.getRequest();
if (request != null) {
SuperUser superUser = new SuperUser();
superUser.setUserName(userName);
superUser.setPasswd(passwd);
request.getSession().setAttribute("superUser", superUser);
users.put(superUser.getUserName(), superUser);
}
return users.keySet();
}
public static class SuperUser {
private String userName;
private String passwd;
public String getUserName() {
return userName;
}
public void setUserName(String userName) {
this.userName = userName;
}
public String getPasswd() {
return passwd;
}
public void setPasswd(String passwd) {
this.passwd = passwd;
}
}
}@Endpoint(id = "super")必须要加ID,这样就可以浏览器访问/actuator/super
注册为bean
1
2
3
4
5
6
7
8
9
10
11
12
13
14
15
16
17import org.springframework.boot.actuate.autoconfigure.endpoint.condition.ConditionalOnEnabledEndpoint;
import org.springframework.boot.web.servlet.ServletComponentScan;
import org.springframework.context.annotation.Bean;
import org.springframework.context.annotation.Configuration;
import com.cff.springbootwork.actuator.endpoint.SuperEndPoint;
public class MvcEndPointConfig {
public SuperEndPoint superEndPoint() {
return new SuperEndPoint();
}
}定义filter对访问actuator限制
actuator的接口要做保护,可以用filter做简单的保护
对
/actuator/*下所有的路径过滤,并用actuator.filter.switch属性对filter做开关如果是
/actuator/super路径的post操作,放行,往request放一个对象其他
/actuator/*下路径要判断request中是否有user对象,没有就返回报错信息
1
2
3
4
5
6
7
8
9
10
11
12
13
14
15
16
17
18
19
20
21
22
23
24
25
26
27
28
29
30
31
32
33
34
35
36
37
38
39
40
41
42
43
44
45
46
47
48
49
50
51
52
53
54
55
56
57
58import java.io.IOException;
import javax.servlet.Filter;
import javax.servlet.FilterChain;
import javax.servlet.FilterConfig;
import javax.servlet.ServletException;
import javax.servlet.ServletRequest;
import javax.servlet.ServletResponse;
import javax.servlet.annotation.WebFilter;
import javax.servlet.http.HttpServletRequest;
import javax.servlet.http.HttpServletResponse;
import org.springframework.beans.factory.annotation.Value;
import org.springframework.core.annotation.Order;
import org.springframework.http.HttpMethod;
import org.springframework.http.HttpStatus;
import org.springframework.http.MediaType;
import com.fasterxml.jackson.databind.ObjectMapper;
// 指定过滤器的执行顺序,值越大越靠后执行
public class ActuatorPermissionFilter implements Filter {
private String excludePath = "actuator/super";
Boolean actuatorSwitch;
public void init(FilterConfig filterConfig) {
}
public void doFilter(ServletRequest servletRequest, ServletResponse servletResponse, FilterChain filterChain)
throws IOException, ServletException {
HttpServletRequest request = (HttpServletRequest) servletRequest;
HttpServletResponse response = (HttpServletResponse) servletResponse;
if (actuatorSwitch && !(request.getRequestURI().endsWith(excludePath)
&& request.getMethod().equals(HttpMethod.POST.toString()))) {
Object user = request.getSession().getAttribute("superUser");
if (user == null) {
// 未登录,返回数据
ObjectMapper mapper = new ObjectMapper();
response.setStatus(HttpStatus.OK.value());
response.setContentType(MediaType.APPLICATION_JSON_UTF8_VALUE);
mapper.writeValue(response.getWriter(), "您没有权限访问该接口,请使用自定义的登录接口设置superUser后使用!");
return;
}
}
filterChain.doFilter(servletRequest, servletResponse);
}
public void destroy() {
}
}监控页面
使用Springboot monitor做监控页面
Spring Boot Monitor是一个对Spring boot admin监控工具做修改并适配单机的监控工具,完美继承了Spring boot admin的风格,直接使用actuator的指标进行显示。
官网: https://www.pomit.cn/SpringBootMonitor1
2
3
4
5<dependency>
<groupId>cn.pomit</groupId>
<artifactId>spring-boot-monitor</artifactId>
<version>0.0.1</version>
</dependency>

