1. 概述
Prometheus使用各种数据算法实现强大的监控需求,并且原生支持K8s的服务发现,能监控容器的动态变化,结合Grafana绘出漂亮的图形,最终使用altermanager
或Grafana实现报警
它与其他监控相比有以下主要优势:
数据格式是Key/value形式,简单、速度快
监控数据的惊喜程度达到秒级(对磁盘消耗大,存在性能瓶颈,不支持集群)
不依赖分布式存储,数据直接保存在本地,不需要额外的数据库配置,如果对历史数据有较高要求,结合OpenTSDB
周边插件丰富
本身基于数学计算模型,有大量的函数可用,可以实现很复杂的监控
可以潜入很多开源工具的内部区进行监控,数据更可信
1.1 主要组件
服务端
Prometheus服务端是一个进程方式启动,如果不考虑参数和后台运行的话,解压后
./prometheus即可启动,默认监听9090端口,每次采集到的数据叫 metrics。这些采集到的数据会
先放到内存中更,然后定期写入磁盘,如果服务重新启动会将磁盘数据写回到内存中,所以对内存有一定消耗,而且默认只会保留15天历史数据。客户端
Prometheus客户端分为
pull和push两种方式:- pull
服务端主动想客户端拉去数据,这样需要客户端安装
exporters导出器作为守护进程,官网提供了很多的exporters下载,比如node_exporters(默认监听9100端口) - push
客户端需要安装pushgateway插件,然后运需要运维人员用脚本把监控数据组织成键值形式提交给pushgateway,再由它提交给服务端。它适合于现有exporters无法满足需求时,自己灵活定制。
- pull
metrics 主要数据类型
Gauges:
最简单、使用最多的指标,获取一个返回值,这个返回值没有变化规律,采集回来是多少就是多少,比如硬盘容量、CPU内存使用率都适合Gauger数据类型
Counters:
计数器,从0开始,理想状态下是永远增长或者不便,适合统计机器开机时间、HTTP访问量
Histograms:
和summary一样属于高级指标,用于统计数据的分布情况。比如最小值、最大值、中间值。这个类型不太好理解,比如说统计一天的日志,大部分用户响应时间都是正常的,只有少量用户异常,如果这个时候取平均值的话,这少量用户的异常情况就会被掩盖过去,而Histograms可以分别统计出全部用户的响应时间,比如0-1秒的用户有多少、1-2秒的用户有多少
2. 服务安装
2.1 Prometheus
进入官网 下载安装各组件包并上传到指定目录
1
2
3
tar zxvf prometheus-2.40.1.linux-amd64.tar.gz
mv prometheus-2.40.1.linux-amd64 /usr/local/prometheus-2.40.1
cd /usr/local/prometheus-2.40.1解压安装包后修改配置
prometheus.yml1
2
3
4
5
6
7
8
9
10
11
12
13
14scrape_configs:
- job_name: "prometheus" #作业名,可以理解为组名,其下可以有多个实例配置
static_configs:
- targets: ["localserver:9090"] #节点的地址,可以写多个地址,这里时spring boot应用的IP+ 端口
- job_name: 'pushgateway'
static_configs:
- targets: ['localserver:9091','localserver:9092']
labels: #自定义标签,可以通过标签进行统一管理
instance: pushgateway
- job_name: 'node exporter'
static_configs:
- targets: ['localserver:9100', 'ubuntu18:9100']这里的 localserver 写为本地的 IP 也可以,或者使用 localhost 代替均可。
配置说明:global配置块:指定prometheus全局配置,比如采集间隔,抓取超时时间等- scrape_interval: 拉取数据的间隔时间,默认为1分钟,继承global值
- scrape_timeout: 抓取超时时间,默认继承global值
- evaluation_interval:规则验证(生成alert)的时间间隔,默认为1分钟
rule_files配置块: 指定报警规则文件,prometheus根据这些规则信息,会推送报警信息到alertmanager中。scrape_configs配置块:配置采集目标相关,prometheus监控的目标,Prometheus自身的运行信息可以通过 HTTP 访问,所以Prometheus 可以监控自己的运行数据。指定抓取配置,prometheus 的数据采集通过此片段配置。➢ job_name:监控作业的名称。他的下一集是instance,也就是target
➢ static_configs:表示静态目标配置,就是固定从某个 target 拉取数据。一个 scrape_config 片段指定一组目标和参数, 目标就是实例,指定采集的端点, 参数描述如何采集这些实例, 主要参数如下
➢ targets : 指定监控的目标, 其实就是从哪儿拉取数据。 metric_path: 抓取路径, 默认是/metrics
➢ *_sd_configs: 指定服务发现配置
Prometheus 会从 http://server:9090/metrics 上拉取数据。
检查配置文件
1
protool check config prometheus.yml
启动prometheus
1
2
3
4
5
6
7
8
9
10
nohup ./prometheus --config.file=prometheus.yml --web.listen-address="0.0.0.0:9090" > ./prometheus.log 2>&1 &
常见参数如下:
--config.file=prometheus.yml:指定配置文件路径
--web.enable-lifecycle #开启热加载配置
--web.listen-address="0.0.0.0:9090" #指定服务端口
--collector.systemd #开启服务状态监控,开启后在WEB上可以看到多出相关监控项
--storage.tsdb.retention.time=15d #数据保留时间
--storage.tsdb.path="/data/prometheus" #指定数据存储路径
--collector.systemd.unit-whitelist=(sshd|nginx).service #具体要监控的服务名访问Web管理界面
2.2 node_exporter(可选)
每个node启动之后通过查询接口,prometheus就能收集到相关信息,在Prometheus架构设计中,Prometheus Server主要负责数据的收集、存储并对外提供数据查询支持,
而实际的监控样本数据的收集则是由Exporter完成的。
因此为了能够监控到某些东西,比如主机的CPU使用率,我们需要使用Exporter, Prometheus周期性的从Exporter暴露的HTTP服务地址(通常是/metrics)拉取监控样本数据
Exporter 可以是一个相对开放的概念,其可以是一个独立运行的程序独立于监控目标以外,也可以是直接内置在监控目标中。只要能够向 Prometheus 提供标准格式的监控样本数据即可。
解压
1
2
3
tar xf node_exporter-1.4.0.linux-amd64.tar.gz
mv node_exporter-1.4.0.linux-amd64 /usr/local/node_exporter-1.4.0
cd /usr/local/node_exporter-1.4.0启动服务
1
2
3
4
5
6
7
8
nohup ./node_exporter > node_exporter.log 2>&1 &
0 – stdin (standard input,标准输入)
1 – stdout (standard output,标准输出)
2 – stderr (standard error,标准错误输出)
查看是否启动成功, 或者使用ss -nltp
ps -ef|grep node访问
request 1
http://localhost:9100/metrics
配置service文件
1
vim /usr/lib/systemd/system/node_exporter.service
1
2
3
4
5
6
7
8
9
Description=node_export
Documentation=https://github.com/prometheus/node_exporter
After=network.target
[Service]
Type=simple
ExecStart= /usr/local/node_exporter-1.4.0/node_exporter
Restart=on-failure
[Install]
WantedBy=multi-user.target重启node_exporter
1
2
systemctl restart node_exporter
systemctl status node_exporter
2.3 PushGateway(可选)
Prometheus在正常情况下是采用pull模式从产生metrics的作业或者exporter拉取监控数据,但要是监控的是Flink on YARN作业,,想让prometheus自动发现作业的提交、结束以及自动拉取数据显然是比较困难的。
PushGateway就是一个中转组件,通过配置Flink on YARN作业将metrics推送到PushGateway,Prometheus再从PushGateway拉取就可以了
1 | [root@localserver /root/prometheus]# tar xf pushgateway-1.4.3.linux-amd64.tar.gz |
启动服务
1 | nohup ./pushgateway --web.listen-address :9091 > ./pushgateway.log 2>&1 & |
2.4 Alertmanager(可选)
1 | [root@localserver /root/prometheus]# tar xf alertmanager-0.24.0.linux-amd64.tar.gz |
启动服务
1 | nohup ./alertmanager --config.file=/usr/local/prometheus-2.40.1/alertmanager.yml > ./alertmanager.log 2>&1 & |
2.5 Grafana
Grafana是一个跨平台的开源的度量分析和可视化工具,可以通过将采集的数据查询然后可视化展示,并及时通知。
特点:
快速灵活的客户端图表,面板插件有许多不同方式的可视化指标和日志,官方库中具有丰富的仪表盘插件、比如热图、折线图、图表等多种展示方式
支持多数据源:Graphite、InfluxDB、OpenTSDB、Prometheus、Elasticsearch、CloudWatch和KairosDB等
通知提醒:以可视化方式定义最重要指标的报警规则,Grafana将不断计算并发送通知,在数据到达阈值时通过Slack、PagerDuty等获得通知
混合展示:同一图表中混合使用不同的数据源,可以基于每个查询指定数据源,甚至指定一数据源
注释标记:使用来自不同数据源的丰富事件注释图表,将鼠标悬停在事件上会显示完整的事件元数据和标记
过滤器:Ad-hoc过滤器允许动态创建新的键/值过滤器,这些过滤器会自动应用与使用该数据源的所有查询
官网地址:Grafana
官方文档:Grafana文档
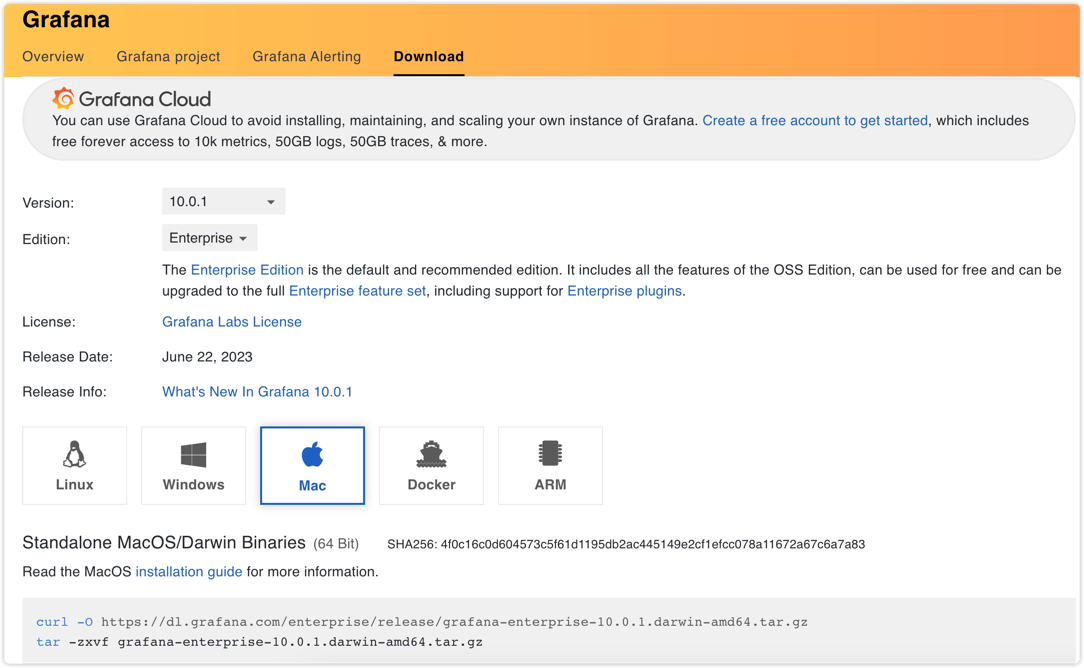
下载安装Grafana
下载地址:https://grafana.com/grafana/download
启动服务
1
2
3
4
5
6service grafana-server start
或者
sudo systemctl daemon-reload
sudo systemctl start grafana-server
sudo systemctl status grafana-server访问服务
request 1
2http://localhost:3000
#默认账号密码:admin/admin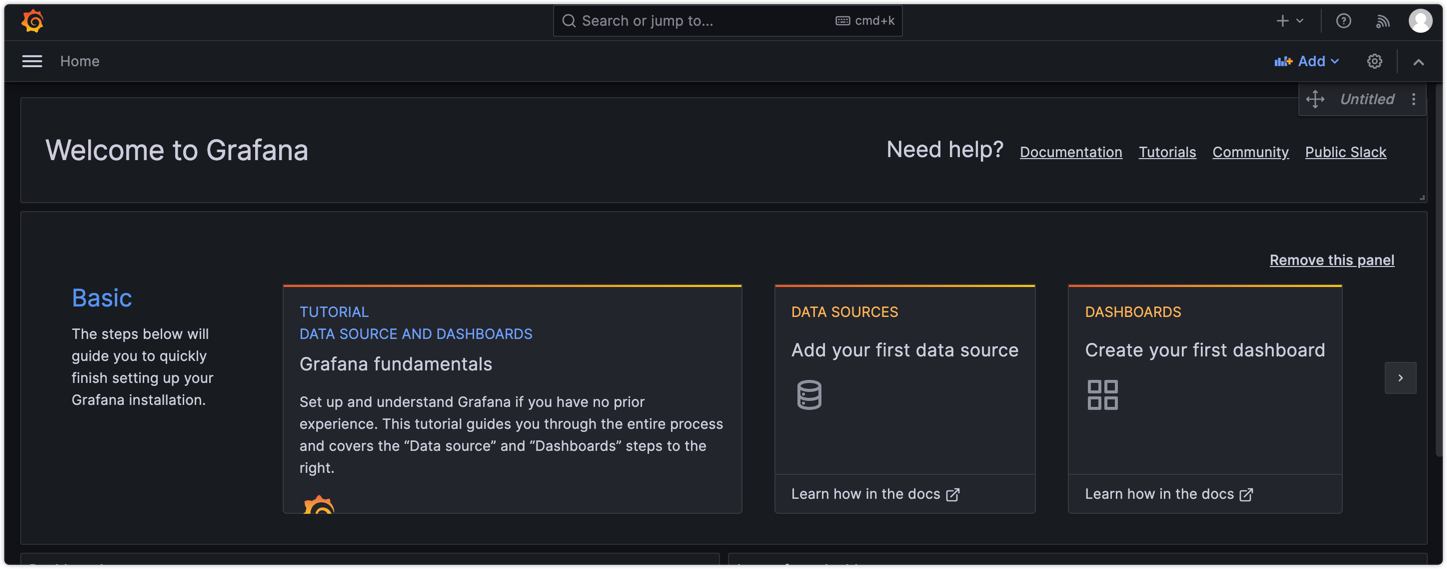
3. SpringBoot集成
添加依赖
1
2
3
4<dependency>
<groupId>org.springframework.boot</groupId>
<artifactId>spring-boot-starter-actuator</artifactId>
</dependency>采集应用的指标信息,使用prometheus包
1
2
3
4<dependency>
<groupId>io.prometheus</groupId>
<artifactId>simpleclient_spring_boot</artifactId> <version>0.0.26</version>
</dependency>在启动类上添加注解
1
2
3
4
5
6
7
8
public class Application {
public static void main(String[] args) {
SpringApplication.run(Application.class, args);
}
}修改配置
1
2
3
4
5
6
7spring:
application:
name: prometheus-demo
security:
user:
password: xiaoyuge
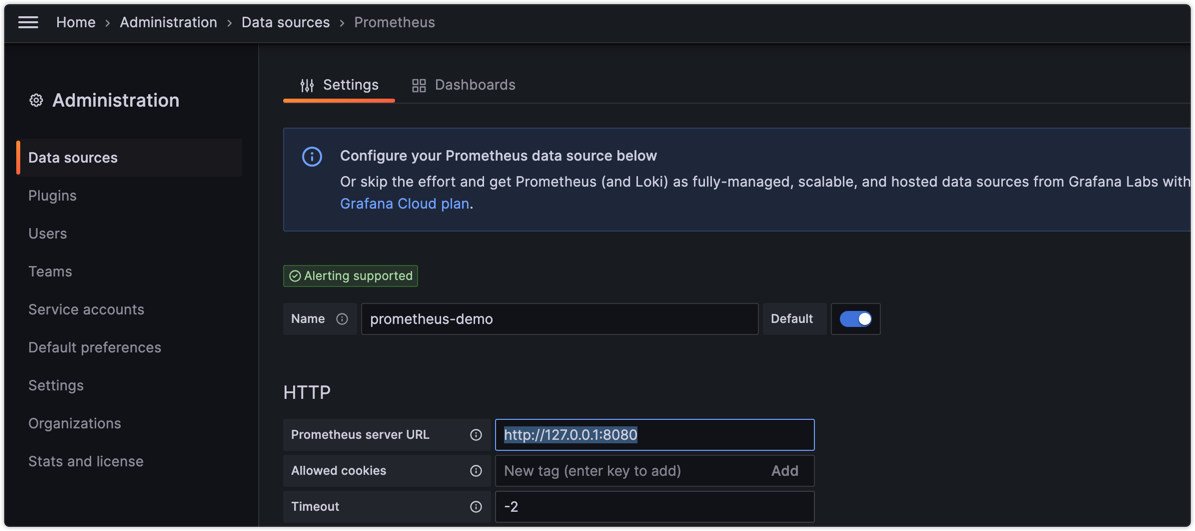
name: admin配置Prometheus数据源
登录grafana
- 配置数据源
- 配置单个指标的可视化监控面板
- 配置数据源

